|
|
|
THIS WEEK'S TOPIC: CRUDE PRICES |
|
|
|
Part IV: Evaluating the state of crude prices |
|
On Friday, July 7, we wrote the first in a series of articles on the state of crude. It is an important subject for propane retailers since the movement in propane prices is so closely connected to the movement in crude prices. We have linked to the previous three articles on this subject. It would be great if you could read those before continuing with this Trader’s Corner (TC) since much of what we were concerned with has come to fruition and this TC is going to show where we stand now.
We learned long ago not to predict where markets are going. There are simply too many variables that can make even the best laid predictions look foolish. What we do is focus on the data and events that suggest that something could happen. In the previous three TC, we laid the foundation for why we believe West Texas Intermediate (WTI) could continue higher and be a support for propane prices. We made our case as to why we thought crude was ready to return to a bull market after being in a bear market since August 2022 and that WTI could move to at least $80 per barrel. |
|
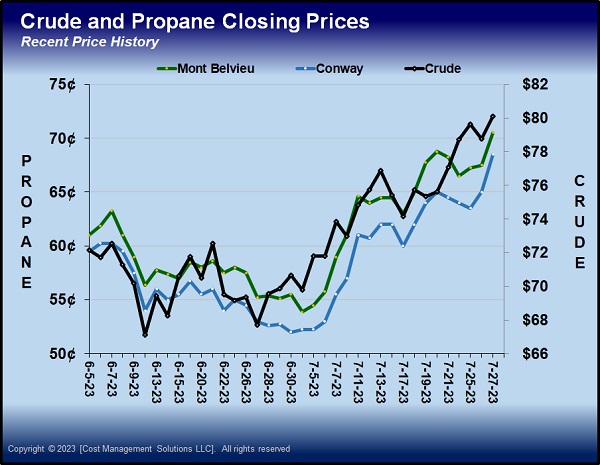
The day we wrote the first installment of the series, WTI crude closed at $73.86. Mont Belvieu ETR propane closed that day at 59 cents and Conway at 55.5 cents. On July 27, WTI closed at $80.09, breaking into bull market territory and above the $80 mark we suggested could fall. So, as we write on July 28, WTI through July 27 had made a $6.23, or 8.43 percent, run since the first TC on the state of crude was written. WTI is up $12.39, or 18.2 percent, since beginning its current rally on June 28.
Mont Belvieu ETR propane closed at 70.5 cents and Conway at 68.5 cents on July 27. Those marked 11.5-cent, 19.49 percent, and 13-cent, 23.42 percent, gains respectively since the first TC on crude was written. Propane has outpaced crude because propane inventory builds have been on the lighter side during this time frame. |
|
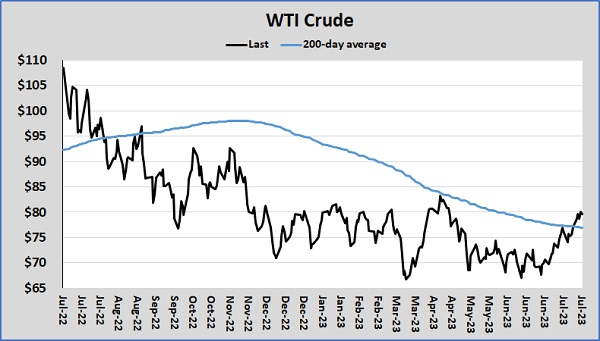
Chart 1 is updated since it was used during the second installment of this series. It shows that WTI’s closing price is now above its 200-day moving price average. This is significant because the 200-day moving price average is considered the demarcation line between a bear and bull crude market. With several days of closes above the 200-day moving price average, WTI has begun a new bull market phase. This kind of break can give buyers, especially technical traders, more confidence to take long positions in crude. Their buying keeps the rally going. |
|
Chart 2 shows recent propane and crude prices. It illustrates the velocity in the uptrend, but it also shows how closely they moved together.
The rally in crude mostly has been caused by a change in what is driving the market. During the bear market that started last August and ended last week, WTI has been driven by worries about crude demand destruction stemming from a weaker global economy. Now, traders and investors are less pessimistic about economic conditions. Inflation is slowing. |
|
|
A report showed headline inflation at an annual rate of 3 percent in June. That was down from an annualized rate of 3.8 percent in May. Data also showed that the upward pressure on wages was less. Rising wages have been a key concern of the Federal Reserve. Core inflation, which excludes fuel and food, is at 4.1 percent. That reading is well above the Fed’s 2 percent target rate but down from 4.6 percent in May. Federal Reserve Chairman Jerome Powell said last week that he believed the U.S. economy may avoid a recession despite all the monetary tightening by the Fed. Keep reading... |
|
|
|
|
PREVIOUS TOPICS
|
|
|
|
|
|
|
RELATED
|
|
|
|
|
|
|
|
|
|
Cost Management Solutions LLC (CMS) is a firm dedicated to the unbiased analysis of the energy markets for the propane industry. Mark Rachal, Director of Research and Publications at CMS, regularly provides insightful looks into various facets of the marketplace. |
|
|
|
|
FROM THE MAGAZINE
|
|
|
|
|
|
|
|
|
|
|
You are currently subscribed to LP Gas as @{Email Name}@ |


