|
|
|
THIS WEEK'S TOPIC: PROPANE DEMAND |
|
|
|
Weak propane prices expected despite strong export activity |
|
Recently, we were challenged on our increasingly bearish view of this winter’s propane prices. The challenge was based on the exceptionally strong propane export activity currently underway and the potential for higher crude prices.
To be sure, our bias toward a weaker pricing environment is based primarily on our outlook for domestic demand. We believe weak crop drying, followed by likely El Nino conditions that will impact demand in the higher-consuming north, especially in late winter, are threats to demand. So are a weakening economy and a financially stressed consumer that is struggling against high prices due to rates of inflation not seen for decades. Reports suggest that many consumers are maxed out from a credit standpoint. |
|
Even if a consumer can get credit, it is high. The Fed has increased interest rates from 0 percent to 0.25 percent to 5.25 percent to 5.5 percent during the past year and a half. Increasingly high yields on U.S. Treasuries are causing rates on mortgages and credit cards to go even higher. We read that for someone trying to buy a home, the average mortgage payment nearly doubled over the past 12 months. Rent also has been increasing in response to the higher price of owning. In fact, the U.S. Department of Labor pointed to rent increases as a key contributor to inflation not coming down in September. For these reasons, we feel the consumer will be forced to conserve everything, including propane. |
|
We enter the winter of 2023-24 with record high propane inventories and threats to domestic demand. If higher propane prices develop this winter, they likely will be driven by higher propane exports and higher crude prices.
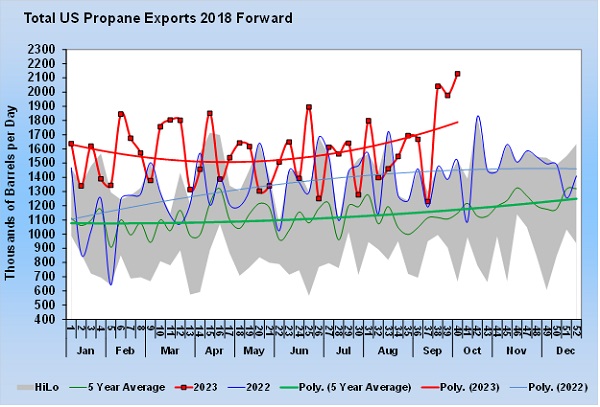
Chart 1 shows U.S. propane exports. It is easy to see why those wanting to challenge a bearish propane pricing environment would point to exports. They are at a record high and trending up. |
|
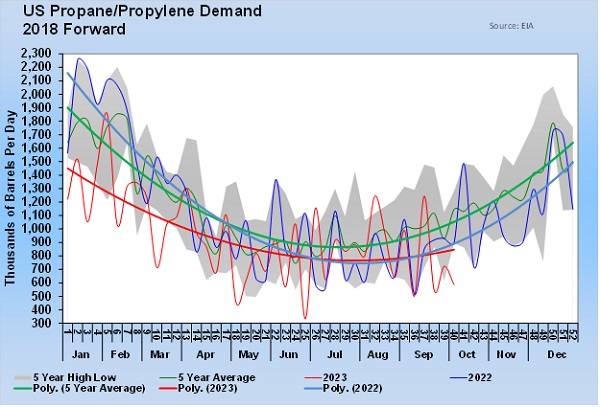
Chart 2 is domestic propane. It was extremely low at the beginning of the year. As we predicted, it recovered during preparation for this winter and, by June, was trending above last year’s rate. But now that much of the preparation for winter is complete, domestic demand is once again trending below last year.
Remember that the demand number in Chart 2 is a calculated number. The U.S. Energy Information Administration does not collect data on domestic demand. Instead, it collects data on propane imports, exports, production and inventories. It then infers what demand must have been based on the other data points. If the data is off in other areas, it skews the domestic demand number as well. We often see a huge jump in exports, resulting in a corresponding fall in domestic demand and vice versa. That is why we focus on the trend lines in Charts 1 and 2 rather than the weekly numbers. Combining export and domestic demand is useful as well. |
|
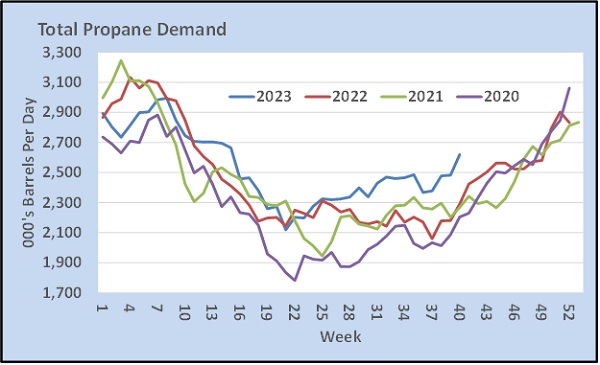
Even with the low domestic demand, the high export rates mean overall demand is higher than the past few years. This supports the argument against being too bearish about propane prices.
A key question to ask when considering the future price of propane is: Why are exports so high, and are there reasons they could fall? Keep reading... |
|
|
|
|
RELATED
|
|
|
|
|
|
|
PREVIOUS TOPICS
|
|
|
|
|
|
|
|
|
|
Cost Management Solutions LLC (CMS) is a firm dedicated to the unbiased analysis of the energy markets for the propane industry. Mark Rachal, Director of Research and Publications at CMS, regularly provides insightful looks into various facets of the marketplace. |
|
|
|
|
FROM THE MAGAZINE
|
|
|
|
|
|
|
|
You are currently subscribed to LP Gas as @{Email Name}@ |


