|
|
|
THIS WEEK'S TOPIC: CRUDE DEMAND |
|
|
|
What lower crude demand in the US means for propane retailers |
|
Last Thursday, the Organization of the Petroleum Exporting Countries (OPEC) and cooperating producer nations, known as OPEC+, decided to take more crude off the market to support crude’s price. If they follow through with the plan, they will be producing around 6.2 million barrels per day (bpd) below their benchmark production rates. That was the crude production rate established before any production quotas were put in place. |
|
OPEC+ has established individual quotas for each member country so that they share proportional to their production in efforts to support crude’s price. The quotas shared by the members reduce their combined output by around 4 million bpd. Since July, OPEC’s largest producer, Saudi Arabia, has voluntarily cut its production an additional 1 million bpd. OPEC+ member Russia joined it by reducing exports by 300,000 bpd. So, theoretically, since July 2023, OPEC+ has been producing 5.3 million bpd below benchmark rates. |
|
At the latest OPEC+ meeting, the quotas remained the same, and Saudi Arabia extended its voluntary cut through March 2024. Russia raised its voluntary cut to 500,000 bpd, and other OPEC+ members pledged to voluntarily cut an additional 700,000 bpd from production. Therefore, the total reduction in output is made up of around 4 million bpd from quotas and 2.2 million bpd from voluntary cuts.
OPEC+ is making these cuts because it is concerned that the world is going to need less crude, and if they don’t reduce production the price of crude is going to tank. Data shows that the global economy is slowly reducing energy demand. There are concerns that the weakening economic activity will continue throughout 2024. Some believe that by May of next year the U.S. Federal Reserve will need to start reducing interest rates again to help stimulate economic growth. |
|
In this Trader’s Corner, we are going to look at some trends in U.S. data that will provide a picture of how U.S. demand is running. Before we look at the demand side, let’s look at the recent trend in U.S. crude inventories.
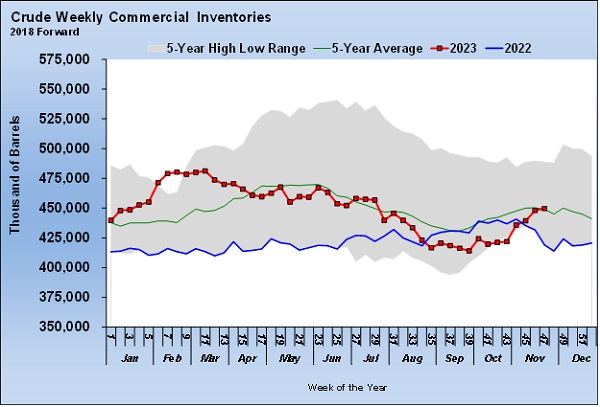
U.S. crude inventories have been rising rapidly over the last few weeks, leading to the downward pressure on crude prices. Weaker crude prices generally lead to lower propane prices, especially when propane fundamentals are not supportive. U.S. crude inventories have gone from setting a five-year low to above the five-year average in a matter of four weeks. |
|
A key driver on the demand side is gasoline.
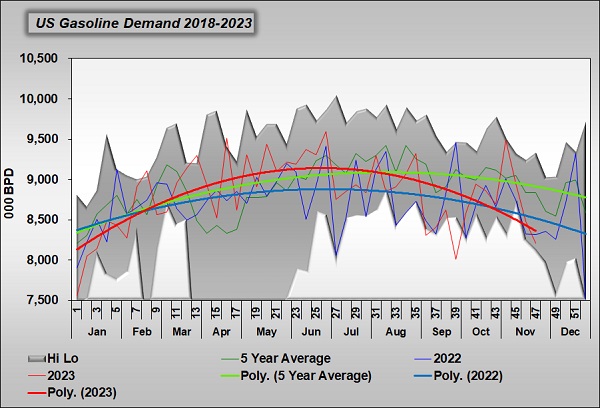
Weekly gasoline demand numbers can be erratic from week to week, so we focus on the trend lines, which we have made bolder in Chart 2. U.S. gasoline demand was running above trend from February through July. Since then, demand has fallen sharply and is running below trend and last year. The seasonal pattern is for demand to fall this time of year, but the decline this year is significantly more than usual. Keep reading... |
|
|
|
|
RECENT HEADLINES
|
|
|
|
|
|
|
PREVIOUS TOPICS
|
|
|
|
|
|
|
|
|
|
Cost Management Solutions LLC (CMS) is a firm dedicated to the unbiased analysis of the energy markets for the propane industry. Mark Rachal, Director of Research and Publications at CMS, regularly provides insightful looks into various facets of the marketplace. |
|
|
|
|
FROM THE MAGAZINE
|
|
|
|
|
|
|
|
You are currently subscribed to LP Gas as @{Email Name}@ |


