|
|
|
THIS WEEK'S TOPIC: CRUDE PRICES |
|
|
|
Back to backwardation for crude |
|
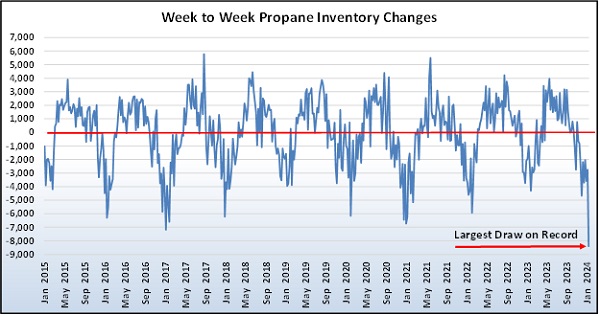
Over the past couple of Trader’s Corners, we have focused on the impacts of the record draw on propane inventories. When that happened, it essentially dictated our Trader’s Corner subject. When such an event occurs, it must be considered.
Just before that occurred, we had planned to discuss a change to the forward price curve for West Texas Intermediate (WTI) crude. It’s fortuitous that our discussion of the subject has been delayed. Events over the past couple of weeks reinforce the points we wanted to make on the subject. |
|
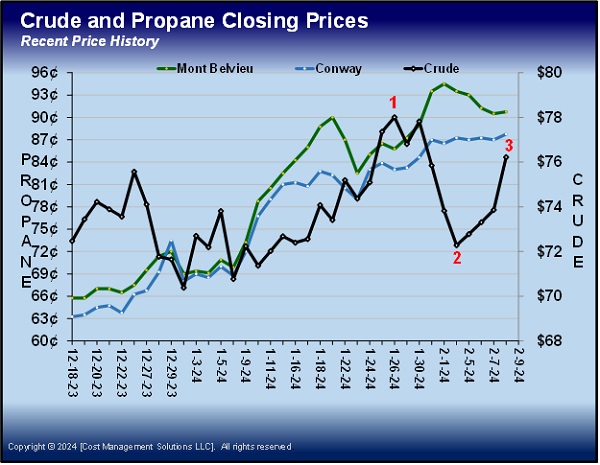
Let’s begin by identifying key points in the discussion with a chart that plots recent closing prices of WTI crude, Mont Belvieu ETR propane and Conway propane. We will focus on the black crude line in Chart 1.
At the end of January (position 1 on Chart 1), crude prices peaked after a long run. The rally in crude was largely due to threats to supply coming from the Middle East. The core driver of prices has been the war between Hamas and Israel in Gaza. But that has spawned other issues that are perhaps even more threatening to supply. |
|
Hamas is an Iranian-backed group, and other such proxies began attacks in support of Hamas. Iranian-backed Houthis in Yemen began attacking shipping in the Red Sea. A U.S.-led coalition responded with naval forces to defend shipping. Even so, many ships stopped using the Red Sea and the connecting Suez Canal in favor of safer, albeit much longer, shipping routes. Struggling to defend the shipping, the U.S.-led coalition went on the offensive, attacking Houthi facilities in Yemen. |
|
Iranian-backed groups in Syria and Iraq stepped up attacks on U.S. military facilities in the region that eventually led to the deaths of three U.S. service members and the wounding of scores more. The U.S. has responded by attacking known facilities of those groups.
In early February (position 2 on Chart 1), crude prices had retreated after Israel proposed a ceasefire in Gaza. Hamas considered it for several days and then offered an alternative agreement, which Israel flatly rejected. While Hamas considered the ceasefire, crude prices fell. But as the hope of a ceasefire waned, WTI crude rallied again to position 3 on the price table of Chart 1. |
|
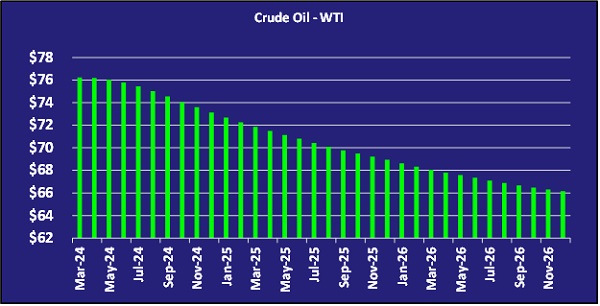
Chart 2 is the current forward price curve for WTI crude. For the sake of space, we do not put up the forward curve for the end of January (position 1). It is practically a duplicate of the one above. Crude’s price and forward curve have come full circle between positions 1 and 3 on the price table. Keep reading... |
|
|
|
|
PREVIOUS TOPICS
|
|
|
|
|
|
|
RECENT HEADLINES
|
|
|
|
|
|
|
|
|
|
Cost Management Solutions LLC (CMS) is a firm dedicated to the unbiased analysis of the energy markets for the propane industry. Mark Rachal, Director of Research and Publications at CMS, regularly provides insightful looks into various facets of the marketplace. |
|
|
|
|
FROM THE MAGAZINE
|
|
|
|
|
|
|
|
|
|
|
You are currently subscribed to LP Gas as @{Email Name}@ |


